OpenShift allows you to run – among the Virtual Machines – containerised workloads. One of the biggest benefit of containers is the ability to turn large projects into small containers (microservices), what enables you to develop and manage them independently from each other. One of the most important aspects of service management is to scale it accordingly to the load to make its users happy. You can try to predict the load and provide enough resources to handle it or you can rely on automated scaling. Manual scaling can be challenging and often can cause under or over capacity – situation where you provide too much or not enough resources to handle the load. Both situations can cause lost in reputation, budget or both together. This is where automatic scaling comes with help! 🙂
OpenShift provides the following built-in autoscaling solutions:
- HorizontalPodAutoScaler (HPA) – adds or removes pods based on simple CPU/Memory usage metrics
- VerticalPodAutoScaler (VPA) – updates the resource limits and requests accordingly to historic and current CPU and memory usage
- Custom Metrics Autoscaler Operator – increase or decrease the number of pods based on custom metrics (other than only Memory or CPU)
In this post I will focus on the first one – HorizontalPodAutoScaler (HPA).
Metrics in OpenShift
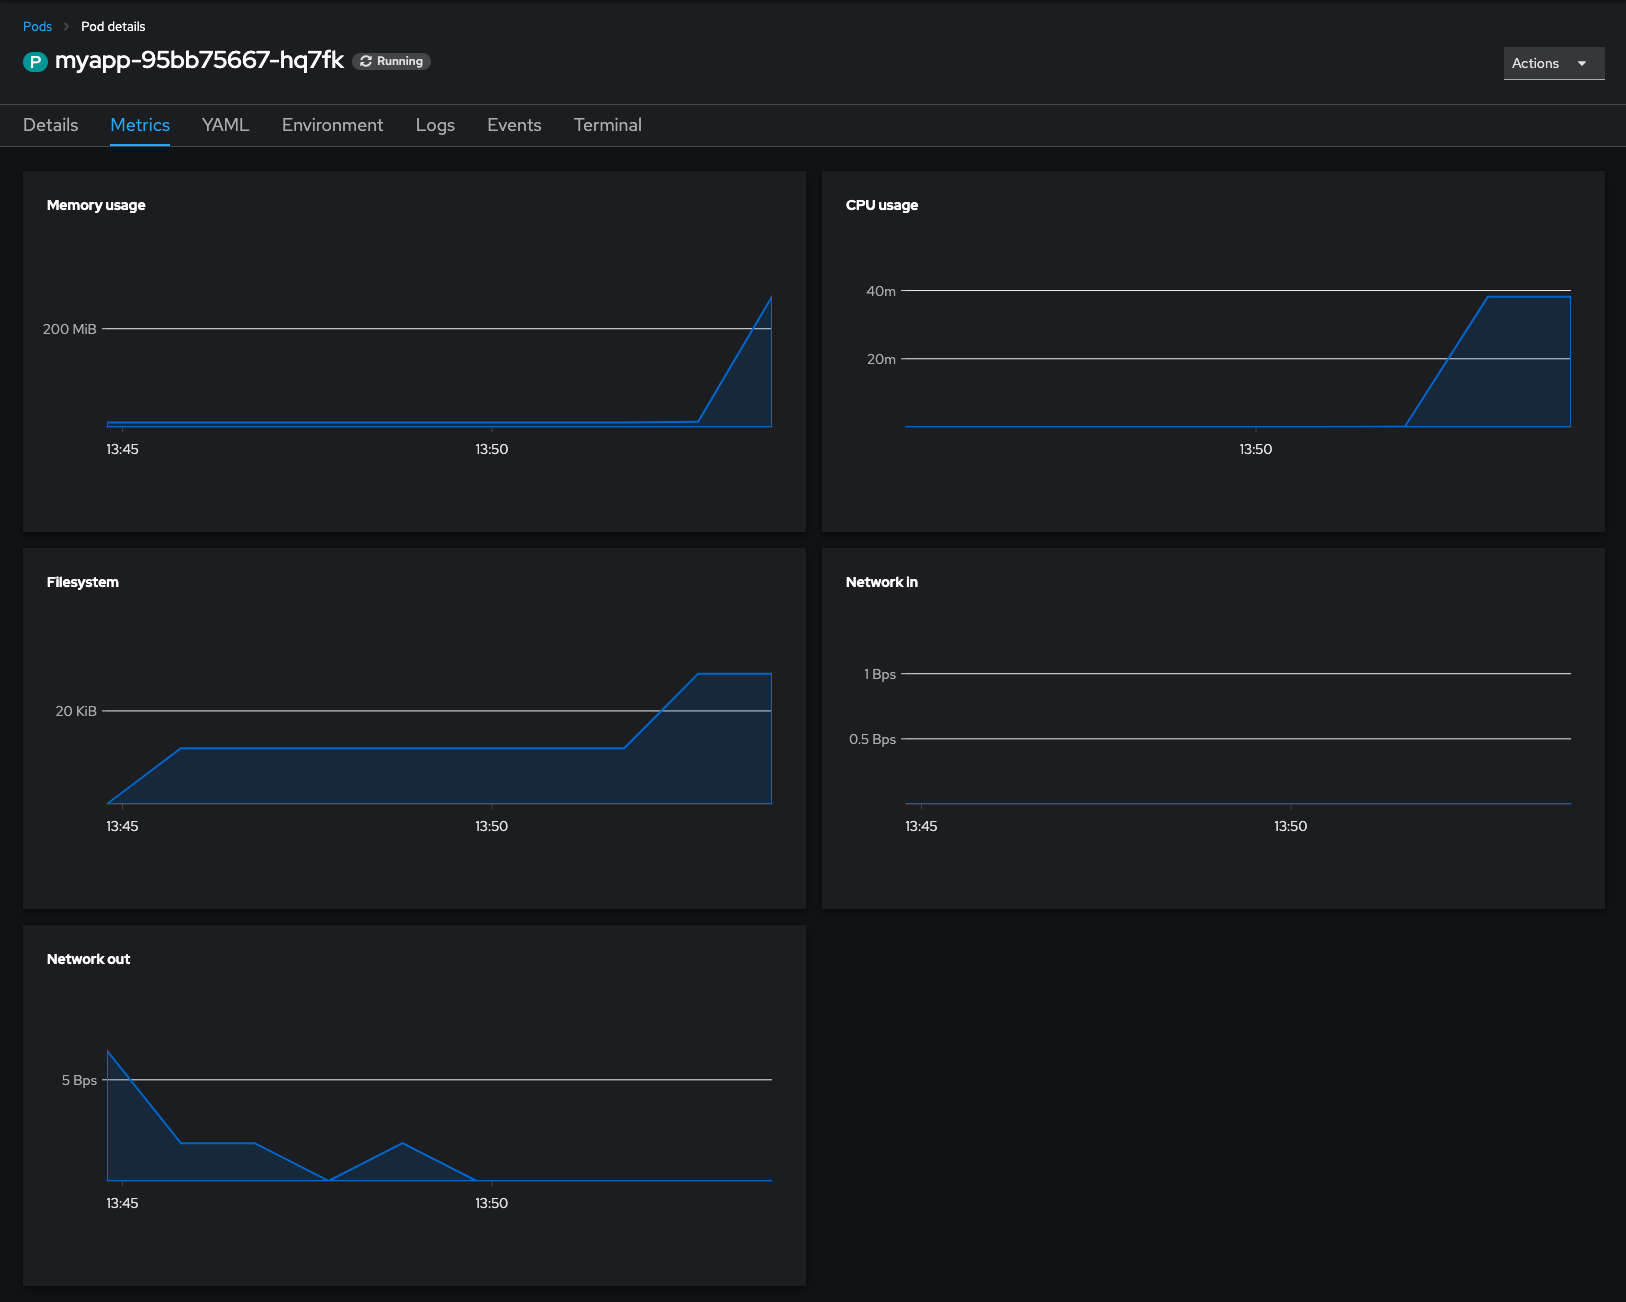
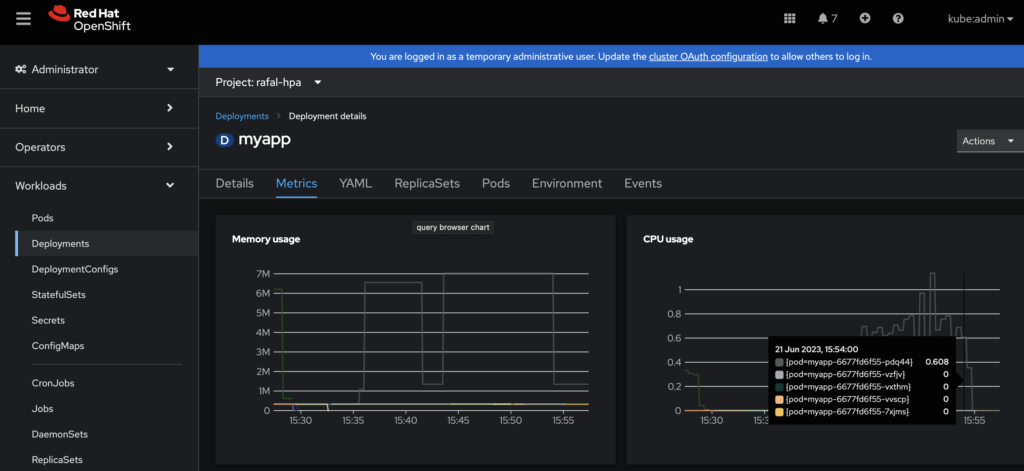
OpenShift out of the box collects CPU and memory usage metrics from the running workloads. You can easily view them running oc adm top pods or oc describe PodMetrics commands, for an instance:
$ oc adm top pods
NAME                    CPU(cores)   MEMORY(bytes)
myapp-95bb75667-hq7fk   230m         15Mi

$ oc describe PodMetrics myapp-95bb75667-hq7fk
(...)
Containers:
  Name:  myapp
  Usage:
    Cpu:     230m
    Memory:  15768Ki
(...)
Additionally you can see simple graphs in OpenShift WebUI:
Creating “MyApp” test workload
To have some fun with HPA let’s create an example application. To make things easier I created the myapp image from the following simple Containerfile:
FROM fedora:38
RUN dnf install -y stress-ng pv
CMD ["/usr/bin/sleep", "infinity"]
$ podman build --arch x86_64 -t default-route-openshift-image-registry.apps.ocp4.openshift.one:443/rafal-hpa/myapp:v1.0 .
STEP 1/3: FROM fedora:38
STEP 2/3: RUN dnf install -y stress-ng pv
Fedora 38 - x86_64 4.5 MB/s | 83 MB 00:18
Fedora 38 openh264 (From Cisco) - x86_64 1.3 kB/s | 2.5 kB 00:01
Fedora Modular 38 - x86_64 1.3 MB/s | 2.8 MB 00:02
Fedora 38 - x86_64 - Updates 2.1 MB/s | 24 MB 00:11
Fedora Modular 38 - x86_64 - Updates 1.2 MB/s | 2.1 MB 00:01
Last metadata expiration check: 0:00:02 ago on Thu Jun 15 09:31:49 2023.
Dependencies resolved.
================================================================================
Package Architecture Version Repository Size
================================================================================
Installing:
pv x86_64 1.6.20-6.fc38 fedora 66 k
stress-ng x86_64 0.15.06-1.fc38 fedora 2.4 M
Installing dependencies:
Judy x86_64 1.0.5-31.fc38 fedora 132 k
libbsd x86_64 0.11.7-4.fc38 fedora 112 k
libmd x86_64 1.0.4-3.fc38 fedora 39 k
lksctp-tools x86_64 1.0.19-3.fc38 fedora 92 k
Transaction Summary
================================================================================
Install 6 Packages
Total download size: 2.8 M
Installed size: 10 M
Downloading Packages:
(1/6): libbsd-0.11.7-4.fc38.x86_64.rpm 634 kB/s | 112 kB 00:00
(2/6): Judy-1.0.5-31.fc38.x86_64.rpm 414 kB/s | 132 kB 00:00
(3/6): libmd-1.0.4-3.fc38.x86_64.rpm 117 kB/s | 39 kB 00:00
(4/6): lksctp-tools-1.0.19-3.fc38.x86_64.rpm 612 kB/s | 92 kB 00:00
(5/6): pv-1.6.20-6.fc38.x86_64.rpm 2.1 MB/s | 66 kB 00:00
(6/6): stress-ng-0.15.06-1.fc38.x86_64.rpm 4.5 MB/s | 2.4 MB 00:00
--------------------------------------------------------------------------------
Total 1.8 MB/s | 2.8 MB 00:01
Running transaction check
Transaction check succeeded.
Running transaction test
Transaction test succeeded.
Running transaction
Preparing : 1/1
Installing : lksctp-tools-1.0.19-3.fc38.x86_64 1/6
Installing : libmd-1.0.4-3.fc38.x86_64 2/6
Installing : libbsd-0.11.7-4.fc38.x86_64 3/6
Installing : Judy-1.0.5-31.fc38.x86_64 4/6
Installing : stress-ng-0.15.06-1.fc38.x86_64 5/6
Installing : pv-1.6.20-6.fc38.x86_64 6/6
Running scriptlet: pv-1.6.20-6.fc38.x86_64 6/6
Verifying : Judy-1.0.5-31.fc38.x86_64 1/6
Verifying : libbsd-0.11.7-4.fc38.x86_64 2/6
Verifying : libmd-1.0.4-3.fc38.x86_64 3/6
Verifying : lksctp-tools-1.0.19-3.fc38.x86_64 4/6
Verifying : pv-1.6.20-6.fc38.x86_64 5/6
Verifying : stress-ng-0.15.06-1.fc38.x86_64 6/6
Installed:
Judy-1.0.5-31.fc38.x86_64 libbsd-0.11.7-4.fc38.x86_64
libmd-1.0.4-3.fc38.x86_64 lksctp-tools-1.0.19-3.fc38.x86_64
pv-1.6.20-6.fc38.x86_64 stress-ng-0.15.06-1.fc38.x86_64
Complete!
--> cb48d092d119
STEP 3/3: CMD ["/usr/bin/sleep", "infinity"]
COMMIT myapp:v1.0
--> af37513c7c54
Successfully tagged localhost/myapp:v1.0
af37513c7c542a624b74f578b0ec3a54ac63b3e9b01e27019e8a67e718d2eb07Push it to my OpenShift’s internal registry:
$ podman push default-route-openshift-image-registry.apps.ocp4.openshift.one:443/rafal-hpa/myapp:v1.0
Getting image source signatures
Copying blob sha256:fb7b7e1a70dd14da904e1a241e8ed152ed9cc7153c9bd16f95db33e77891da6b
Copying blob sha256:dda8af7b00b7fe3b1c22f7b09aace1a2d0a32018905f3beaaa53f45ad97a3646
Copying config sha256:af37513c7c542a624b74f578b0ec3a54ac63b3e9b01e27019e8a67e718d2eb07
Writing manifest to image destination
Storing signatures
So now I can create a Deployment from it:
$ oc new-app --image default-route-openshift-image-registry.apps.ocp4.openshift.one/rafal-hpa/myapp:v1.0 --name myapp --insecure-registry=true
--> Found container image af37513 (2 hours old) from default-route-openshift-image-registry.apps.ocp4.openshift.one for "default-route-openshift-image-registry.apps.ocp4.openshift.one/rafal-hpa/myapp:v1.0"

    * An image stream tag will be created as "myapp:v1.0" that will track this image

--> Creating resources ...
    deployment.apps "myapp" created
--> Success
    Run 'oc status' to view your app.
At this stage I got a single container running controlled by the Deployment
$ oc get pods,deployments
NAME                         READY   STATUS    RESTARTS   AGE
pod/myapp-77dbd8bc94-v2fjc   1/1     Running   0          94s

NAME                    READY   UP-TO-DATE   AVAILABLE   AGE
deployment.apps/myapp   1/1     1            1           95s
Since it is very small and simple it does not use any significant amount of resources for now
$ oc adm top pods
ocNAME                     CPU(cores)   MEMORY(bytes)
myapp-77dbd8bc94-v2fjc   0m           0Mi

$ oc describe podmetrics myapp-77dbd8bc94-v2fjc
Name:         myapp-77dbd8bc94-v2fjc
Namespace:    rafal-hpa
Containers:
  Name:  myapp
  Usage:
    Cpu:     0
    Memory:  328Ki
Kind:        PodMetrics
Events:                <none>
Requests and Limits
For each compute resource, a container may specify a resource Request and Limit.
Request are being used during scheduling to find suitable compute node which can provide requested amount of resources (CPU, memory). They are also being used by HorizontalPodAutoscaler to calculate the current resource usage vs expected usage expressed in percents. Container can go above values described by Requests but their availability is not guaranteed, so it may happen it won’t be able to get more CPU or memory on the current node.
Limits on the other hand specify the maximum amount of resources (CPU, memory) that container may consume. Container won’t be able to use more than Limit specifies.
If one configures Limits but omits Requests, Request will be automatically configured with the Limit value.
You have to set Requests if you want to configure HorizontalPodAutoscaler to scale your application based on the percentage of resource usage. It is not required though if you use exact value to describe memory or CPU usage, such like 500m (milicores) or 256Mi (megabinary).
More detailed definition of Requests and Limits can be found in this document: Resource requests and overcommitment
For my example MyApp I will set requests to 500m of CPU and 128Mi of memory and set the limits to 1000m CPU and 256Mi of memory. These settings mean that scheduler will try to find a node which has at least 500m CPU and 128Mi of memory available, these values will be also taken into account in case of HPA configured to use percentage (%) of the requested values. Additionally my example MyApp will be capped at 1000m CPU (one core) and 256Mi of memory.
$ oc set resources deployment myapp --requests=cpu=500m,memory=128Mi --limits=cpu=1000m,memory=256Mi
deployment.apps/myapp resource requirements updated
Autoscaling based on CPU usage
OpenShift CLI (oc) comes with handy extension capable to set CPU based Horizontal pod auto-scaling straight from the command line (please note it is only capable now to configure CPU based HPA, no option for memory is available at the time of writing it where oc CLI version is 4.13.4):
oc autoscale (-f FILENAME | TYPE NAME | TYPE/NAME) [--min=MINPODS] --max=MAXPODS [--cpu-percent=CPU] [options]Having in mind that in the previous step I configured CPU requests for 100m cores I want to scale-out my deployment where the average usage of CPU across all running pods will go above 50% so 250m core. I also want to ensure there will be at least two replicas on my application running for availability reasons and it won’t go above 10 replicas.
$ oc autoscale deployment myapp --min=2 --max=10 --cpu-percent=50
horizontalpodautoscaler.autoscaling/myapp autoscaled
Immediately after running the command above OpenShift will start additional running copy of my pod to satisfy requirement of minimum 2 replicas running:
$ oc get pods
NAME                     READY   STATUS    RESTARTS   AGE
myapp-6677fd6f55-pdq44   1/1     Running   0          27s
myapp-66d77bbf56-5g9lj   1/1     Running   0          20m
After a short while it will also start monitoring CPU usage and report it under HPA object:
$ oc get hpa
NAME    REFERENCE          TARGETS   MINPODS   MAXPODS   REPLICAS   AGE
myapp   Deployment/myapp   0%/50%    2         10        2          2m45s

$ oc describe hpa
Name:                                                  myapp
Namespace:                                             rafal-hpa
Labels:                                                <none>
Annotations:                                           <none>
CreationTimestamp:                                     Wed, 21 Jun 2023 14:58:20 +0200
Reference:                                             Deployment/myapp
Metrics:                                               ( current / target )
  resource cpu on pods  (as a percentage of request):  0% (0) / 50%
Min replicas:                                          2
Max replicas:                                          10
Deployment pods:                                       2 current / 2 desired
Conditions:
  Type            Status  Reason               Message
  ----            ------  ------               -------
  AbleToScale     True    ScaleDownStabilized  recent recommendations were higher than current one, applying the highest recent recommendation
  ScalingActive   True    ValidMetricFound     the HPA was able to successfully calculate a replica count from cpu resource utilization (percentage of request)
  ScalingLimited  False   DesiredWithinRange   the desired count is within the acceptable range
Events:
  Type    Reason             Age    From                       Message
  ----    ------             ----   ----                       -------
  Normal  SuccessfulRescale  2m32s  horizontal-pod-autoscaler  New size: 2; reason: Current number of replicas below Spec.MinReplicas
Since the pod I run just sleeps (remember CMD ["/usr/bin/sleep", "infinity"] from the Containerfile? What a life! 🙂 ) it reports 0% of usage. Let’s put some load there to wake up HPA (please note change of the directory to /tmp – stress-ng needs write permissions to the current directory):
$ oc rsh myapp-6677fd6f55-pdq44
sh-5.2$ cd /tmp
sh-5.2$ stress-ng -c 1
stress-ng: info:  [19] defaulting to a 86400 second (1 day, 0.00 secs) run per stressor
stress-ng: info:  [19] dispatching hogs: 1 cpu
In another terminal run oc get -w hpa to watch HPA status changes:
$ oc get hpa -w
NAME    REFERENCE          TARGETS   MINPODS   MAXPODS   REPLICAS   AGE
myapp   Deployment/myapp   0%/50%    2         10        2          44m
myapp   Deployment/myapp   60%/50%   2         10        2          45m
myapp   Deployment/myapp   60%/50%   2         10        3          45m
myapp   Deployment/myapp   40%/50%    2         10        5          45m
myapp   Deployment/myapp   46%/50%    2         10        5          45m
By default HPA has scale-down policy configured to wait 300 seconds before pods will be removed. This is just to avoid unnecessary ping-ping while adding and removing pods just because load fluctuates a bit. For demo purposes I modified this default policy and configured it to 15 seconds. Therefore I don’t have to wait too long once load decreases to see HPA removing the pods.
$ oc patch hpa myapp -p '{"spec": {"behavior": {"scaleDown": {"stabilizationWindowSeconds": 15 }}}}'
horizontalpodautoscaler.autoscaling/myapp patched
I cancelled stress-ng process started earlier so the load will go down and HPA remove all extra pods, keeping just 2 of them as requested.
myapp   Deployment/myapp   48%/50%    2         10        5          46m
myapp   Deployment/myapp   35%/50%    2         10        5          47m
myapp   Deployment/myapp   0%/50%     2         10        2          47m
This concludes the CPU auto-scaling exercise. Please remember you can also track metrics and events using WebUI or oc get events -w command among the others.
Autoscaling based on Memory usage
Autoscaling based on memory works in similar fashion as CPU based, however oc CLI tool does not provide option to set it up straight from the command line. Therefore my approach here is firstly create autoscaler with minimum and maximum number of pods and then edit it to add memory based scaling. For an instance:
$ oc autoscale deployment myapp --min=2 --max=10 -o yaml --dry-run=client
apiVersion: autoscaling/v1
kind: HorizontalPodAutoscaler
metadata:
  creationTimestamp: null
  name: myapp
spec:
  maxReplicas: 10
  minReplicas: 2
  scaleTargetRef:
    apiVersion: apps/v1
    kind: Deployment
    name: myapp
status:
  currentReplicas: 0
  desiredReplicas: 0
and change it by adding spec.metrics section as bellow:
apiVersion: autoscaling/v1
kind: HorizontalPodAutoscaler
metadata:
  creationTimestamp: null
  name: myapp
spec:
  maxReplicas: 10
  minReplicas: 2
  scaleTargetRef:
    apiVersion: apps/v1
    kind: Deployment
    name: myapp
  metrics:
  - resource:
      name: memory
      target:
        averageUtilization: 50
        type: Utilization
    type: Resource
The above HPA example will trigger scale-out action of myapp Deployment if an average memory utilisation across all pods being managed by the deployment will go above 50% of requested memory. Please remember to set memory requests accordingly. For this example I set it the same way as before:
$ oc set resources deployment myapp --requests=cpu=500m,memory=128Mi --limits=cpu=1000m,memory=256Mi
deployment.apps/myapp resource requirements updated
Let’s give it a try and allocate 200Mi of memory on one of the pods within myapp Deployment for 5 minutes:
$ oc get pods
NAME                     READY   STATUS    RESTARTS   AGE
myapp-6677fd6f55-5622v   1/1     Running   0          7m
myapp-6677fd6f55-hxsrn   1/1     Running   0          7m
$ oc rsh myapp-6677fd6f55-5622v
sh-5.2$ cat <( </dev/zero head -c 200m) <(sleep 300) | tail
If you’re still watching HPA you should be able to observe it notices increase of memory usage and scale out Deployment by adding additional pods either to the upper limit or until average memory usage drops bellow 50% of the request, then after 300 seconds (5 minutes) when memory usage drops it automatically scale-in Deployment by reducing number of pods (replicas).
$ oc get hpa myapp -w
NAME    REFERENCE          TARGETS   MINPODS   MAXPODS   REPLICAS   AGE
myapp   Deployment/myapp   0%/50%    2         10        2          10m
myapp   Deployment/myapp   35%/50%   2         10        2          11m
myapp   Deployment/myapp   79%/50%   2         10        2          11m
myapp   Deployment/myapp   79%/50%   2         10        4          12m
myapp   Deployment/myapp   53%/50%   2         10        4          12m
myapp   Deployment/myapp   40%/50%   2         10        4          13m
myapp   Deployment/myapp   40%/50%   2         10        4          14m
myapp   Deployment/myapp   0%/50%    2         10        4          15m
myapp   Deployment/myapp   0%/50%    2         10        2          15m
How does HorizontalPodAutoscaler calculate % of resource usage?
Until now we’ve been using percentage based resource usage against CPU and memory requests but it wasn’t explain yet how does it calculate it. Here is the rule:
$TOTAL_USED / $REQUESTED / $NUM_OF_PODS = used_resources%
For an instance in the last example I configured memory request to 128Mi, number of replicas to 2 and then allocated 200Mi of memory, therefore:
200 / 128 / 2 = .78
and that gave us 79% of memory usage (including memory used by “sleeping” pods). The same rule applies for CPU usage calculations.
How does HorizontalPodAutoscaler calculate number of required pods?
To calculate the ratio how many pods there should be running to meet HPA configuration criteria, the following rule is being used:
new_number_of_pods = ceil( current_number_of_pods * ( currentMetricValue / desiredMetricValue ) )
where currentMetricValue in case of averageUtilization being used is calculated as an average resource usage across all the pods. To put it into example:
Two pods running, 200Mi memory being used, request is for 128Mi and threshold is set to 50% give us:
- current_number_of_pods:
2 - currentMetricValue:
200 / 2 = 100 - desiredMetricValue:
128 * 0.5 = 64 - new_number_of_pods:
ceil( 2 * ( 100 / 64 ) ) = ceil( 3.125 ) = 4
Therefore to address the HPA configuration requirement of 50% of requested memory being used on average, the HPA should scale-out the deployment to 4 total pods.
Once it is scaled out it looks as follows:
- current_number_of_pods:
4 - currentMetricValue:
200 / 4 = 50 - desiredMetricValue:
128 * 0.5 = 64 - new_number_of_pods:
ceil( 4 * ( 50 / 64 ) ) = ceil( 3.125 ) = 4
So there is no need to scale out or scale-in since the number of pods is right to address 50% of 128Mi being used on average.
If the memory usage drops at some point to, let say, 100Mi:
- current_number_of_pods:
4 - currentMetricValue:
100 / 4 = 25 - desiredMetricValue:
128 * 0.5 = 64 - new_number_of_pods:
ceil( 4 * ( 25 / 64 ) ) = ceil( 1.5625 ) =2
Therefore deployment can be scaled-in back to 2 pods.